Online Digital Forensics Courses and Labs
Building a Low-cost and State-of-the-art IoT Security Hands-on Laboratory
Funded by National Science Foundation (NSF)
IoT Smart Car Lab 3: Sensors
Wiring the Sensors
Now we will add sensors to the car. This will allow the Smart Car to gain information about its surroundings.
Plug the Temperature Sensor and the Light Sensor into the breadboard you attached to the Smart Car. Make sure they are in different rows, and that you align them vertically, so that each pin is in a different row. For example, have the pins of the light sensor be in rows 1, 2, 3, and 4, and the pins of the temperature sensor in rows 10, 11, and 12.
On the NodeMCU Motor shield you will see many pins sticking out upwards. One row of the pins is labeled D and has the numbers 1 through 8 at the top. You will also see pins labeled G and 3V3 on the row above these pins.
Using a wire connect the 3V3 pin to the red (+) rail of the breadboard. Using another wire connect the G pin to the blue (-) rail of the breadboard. This will make these rails 3.3V and Ground respectively. We will use these rails to supply power to the sensors.
On the light sensor you will see the pins are labeled VCC, GND, DO, and AO. Connect VCC to the red (+) rail of the breadboard, and connect GND to the blue (-) rail of the breadboard. Connect DO to the pin labeled 5 in the D row of the motor shield. Pin A0 will not be used.
On the temperature sensor you will see the pins are labeled GND, DATA, and VCC. Connect VCC to the red (+) rail of the breadboard, and connect GND to the blue (-) rail of the breadboard. Connect DATA to the pin labeled 7 in the D row of the motor shield.
Checking the Sensors over WiFi
Previously we used Node-Red to communicate with the car over the WiFi using MQTT controls.
Now we will use Node-Red to check the sensors on our vehicle.
Start Node-Red
If you do not still have Node-Red running type the following into Command Prompt again the hit Enter:
Checking the Sensors
Drag another mqtt output node from the "ouput" category of the sidebar. We will use this node to send a message to the controller on the car to check the sensors.
Double-click on the node to bring up the properties. Change the "Server" to localhost:1883. Change the "Topic" to car/sensors. Then click "Done".
Next drag another injection node from the "input" category of the sidebar. Double-click on the node to bring up the properties. Change the topic to car/sensors. Check the box next to "Inject once after 0.1 seconds, then...". Then for "Repeat" change it from "none" to "interval". Set it for every 1 seconds. Connect this node to the mqtt output node.
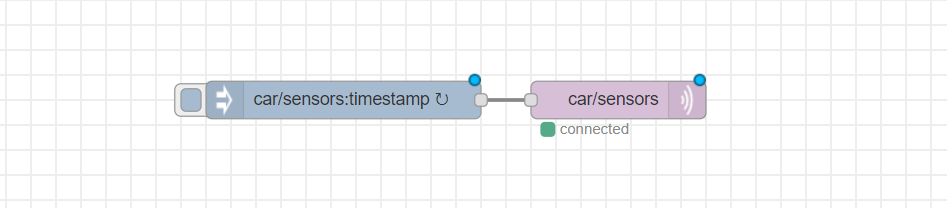
Figure 1: Nodes to check the sensors on the car
Now every second, Node-Red will send out a message on the topic car/sensors which tells the microcontroller on the car to check the sensors attached to the car. These are the light sensor and temperature/humidity sensor.
Reading the Sensor Data
After checking the sensors the car will respond on three topics. They are: car/lights, car/temp, and car/humid.
- On car/lights, the car responds with whether the lights have been turned on if it is sunny or not.
- On car/temp, the car responds with the temperature of the current room the car is in.
- On car/humid, the car responds with the humidity of the current room the car is in.
In order to read the messages coming in on these topics we will need to set up MQTT input nodes. To do so drag the mqtt node from the "input" category of the sidebar.
Double-click on the node to bring up its properties. Set the "Server" to localhost:1883. Set the "Topic" to car/lights. Then click "Done".
Repeat this two more times, changing the topic to car/temp and car/humid.

Figure 2: MQTT input nodes used to check the sensor values
Displaying Sensor Information on the Dashboard
Now that we can get the sensor data the car is sending out we need to display the data onto the dashboard so we can read it.
Back under the "dashboard" tab on the right side of the Node-Red webpage go to the "Layout" tab. Hover over the tab you created and click on "+group" to add another group to the dashboard. Hover over the group and click "edit". Name the group "Sensors" and make sure that the "Tab" is the tab you created earlier. Then click "Update".
In the "dashboard" category on the sidebar on the left you should see a node labeled "text". This node is used to display text onto the dashboard. Drag one out onto the "Flow 1" tab.
Double-click on the node to open its properties. For "Group" select the Sensors group you made earlier. For the label name it "Headlights" or something similar so that you know it is for the headlights of the car. For "Value Format" type in {{msg.payload}}.
Then connect the right side of the car/lights mqtt input node to the left side of this text node.
Repeat this for the car/temp and car/humid input nodes as well.

Figure 3: Nodes used to display the values to the dashboard
After doing so, hit "Deploy" in the upper right-hand of the Node-Red webpage. Then navigate to localhost:1880/ui. You will see that a group has been added to the dashboard which is displaying the status of the headlights, the temperature, and the humidity.
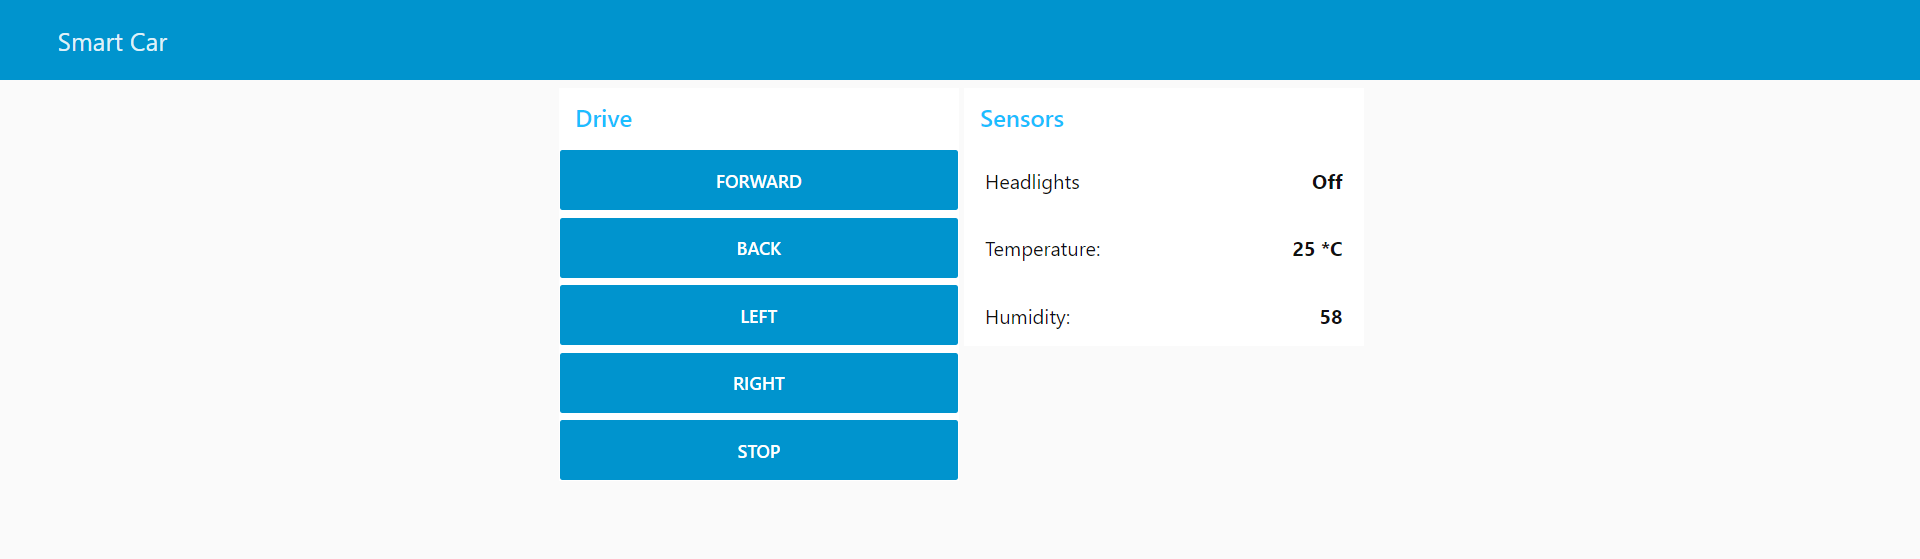
Figure 4: Sensor values being displayed on the dashboard
Now you can drive your car from the dashboard and get information about its surroundings!
Take Away:
- MQTT Inputs and Outputs
- Displaying receieved data to the Node-Red dashboard